Logging can help you better understand the flow of a program and discover undesirable behaviour, which you might not even consider while developing. Logs give you information about scenarios that an application is going through. You can label this information according to its importance: debug, info, warning and errors. Logs can provide more insights than a stack trace by telling you what the program state was before it arrived at the line of code where the error occurred.

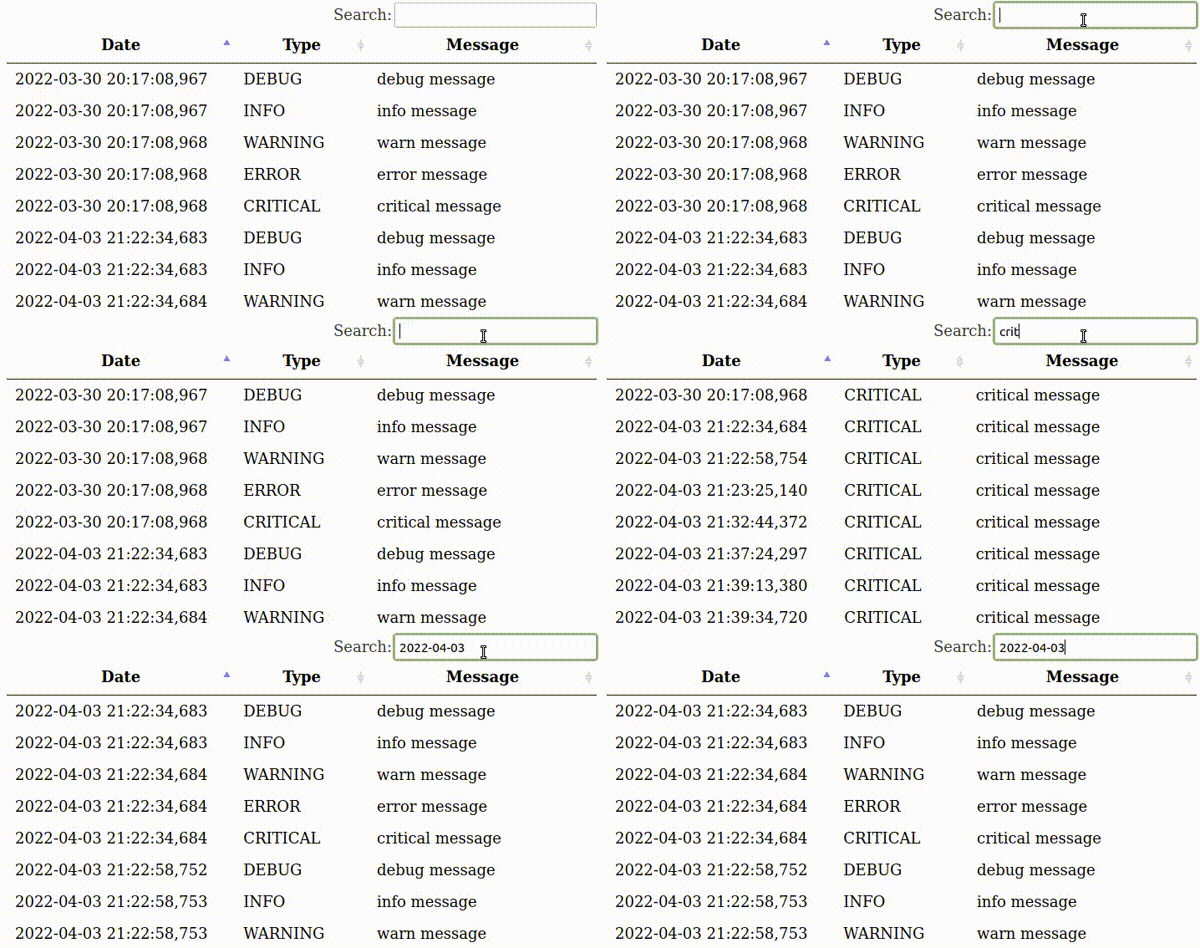
Python provides a logging system as a part of its standard library, so you can quickly add logging to your application. However, having a detailed log with informations gathered from multiple program runs and generated by its different modules is not enough. You should have a method to access and search information in the log. In this post, I propose a web-based log browser. I developed the browser with Flask and Datatables.js. I use it primarily to support my Flask application but it is easy to adapt it to other applications, e.g. written in Tkinter – see my previous post on attaching Flask to a Tkinter application.
Our code has three parts: a logger preparation function, a file log handling function and a log presentation code. Let’s start with the logger preparation. Flask uses the basic logger, so if you apply it in your application, it will flood the output with Flask internal messages. Hence, I define my logger, which additionally gives me more options.
def getLogger():
    # create logger
    logger = logging.getLogger("mylogger")
    logger.setLevel(logging.DEBUG)
    # create file handler and set level to debug
    fh = logging.FileHandler("app.log")
    # create formatter
    formatter = logging.Formatter('%(asctime)s ; %(levelname)s ; %(message)s')
    fh.setFormatter(formatter)
    # add fh to logger
    logger.addHandler(fh)

    return(logger)
In the getLogger function, I created a custom logger called mylogger and used setLevel to adjust the granularity of gathered information. Then, I indicated the log file name and specified the format of logging messages.
In the log handling function, I generated several logging messages, some pretending to come from artificial modules. Then, I loaded the log file and forwarded it to the Jinja template.
def index():
    logger=getLogger()
    logger.debug('debug message - X module')
    logger.info('info message - Y module')
    logger.warning('warn message - Z module')
    logger.error('error message')
    logger.critical('critical message')

    lines=list()
    with open("app.log", 'rt', encoding="utf8", errors="ignore") as csvfile:
        rows= csv.reader(csvfile, delimiter=";")
        for row in rows:
            lines.append(row)

    return render_template_string(jinja_template, lines=lines)
I used render_template_string, which is awkward for such a long Jinja template as I have, but it allows me to keep all the code in a single file, which you can copy-paste and run.
Finally, the Jinja template processed the log’s lines
  <head>
    <script src="https://ajax.googleapis.com/ajax/libs/jquery/3.6.0/jquery.min.js"></script>
    <link rel="stylesheet" type="text/css" href="https://cdn.datatables.net/1.11.5/css/jquery.dataTables.css">
    <script type="text/javascript" charset="utf8"
        src="https://cdn.datatables.net/1.11.5/js/jquery.dataTables.js"></script>
  </head>
  <body>

    <table id="data" class="table table-striped">
    <thead>
    <tr>
        <th>Date</th>
        <th>Type</th>
        <th>Message</th>
    </tr>
    </thead>
    <tbody>
    {% for line in lines %}
    <tr>
        <td>{{ line[0] }}</td>
        <td>{{ line[1] }}</td>
        <td>{{ line[2] }}</td>
    </tr>
    {% endfor %}
    </tbody>
</table>

<script>
    $(document).ready(function() {
        $('#data').DataTable( {
            "paging":   false,
            "ordering": true,
            "info":     false
        } );
    } );

</script>
</code></pre>
The most important part of the code is attachment of the datatables.js library. We have to:
- add JS and CSS dependencies
- create an HTML table
- call the ready() function from the datatables.js library
- pass the identifier of the table to ready().
The whole code: