Stock screeners are effective filters when you have a specific idea of the kinds of companies in which you are looking to invest. There are tens of thousands of stocks listed on world exchanges, so it’s time-consuming to browse them manually. Most available on the Internet screeners offer a decent set of rules and filters. They have a database of equity prices updated regularly. However, the rules and filters are usually predefined, and there is a limited possibility to extend them with more elaborate ideas. Secondly, the equity database focuses on the most popular markets, e.g. US and West Europe stocks, and does not cover more exotic and emerging markets, e.g. Eastern Europe. Using the same rules and applying them to the same markets as everybody else do, will give only average results. Focusing, in turn on markets that are less screened by bots and algorithms (Polish, Hungarian) can give a head-to-head advantage in the pursuit of good returns. So let’s create a custom tool screening the Polish market.

To create a screener, we need an algorithm and data. We will implement the algorithm in Python with the support of the pandas-ta library, which leverages the Pandas library with more dozens of technical indicators and other utility functions. The website stooq provides a whole database of equity prices in CSV format, which you can download for free. The database has complete coverage of all Polish equities and some Hungarian. You can also download equities from popular markets like the US, Germany, Japan or Hong Kong.
Assuming that the data files are stored offline, using the os.walk function, we build a file list. Note that we don’t filter the files according to their type, so it is essential to have only valid CSV files in the chosen directory read by the pd.read function.
for root, dirs, files in os.walk(DB_PATH, topdown=False):
    print("1st for {}".format(root))
    for name in files:
        fp = os.path.join(root, name)
        df = pd.read_csv(fp)
Furthermore, we investigate the headline of the files and write down the names of the columns to process the data. Firstly, we must identify the column with a date that is needed to filter, index and plot the data.
# Convert data in string to date
df[COL_DATE] = df[COL_DATE].apply(pd.to_datetime, format="%Y%m%d")
# Restrict the data which is to be plotted to several months
df = df[df[COL_DATE] >= '2021-01-01']
# Make a date an index of the frame
df.set_index(COL_DATE, inplace=True)
To speed up our computation, we copy the last several rows from the data to compute the single RSI threshold value used to filter the quotes. Then, we have the key function ta.rsi(),
which, as the name suggests, calculates RSI. Next, we check if the indicator value is below the given threshold. If not, we continue and take the next equity.
# For faster computation take only the last RSI_WINDOW+1 data points
df_test = df.iloc[-(RSI_WINDOW+1):].copy()
rsi= df_test.ta.rsi(close=COL_CLOSE)
if rsi[-1] > RSI_THRESHOLD:
    print(colored("{eq} RSI: {val}".
          format(eq=fp,val=round(rsi[-1])),"red"))
    continue
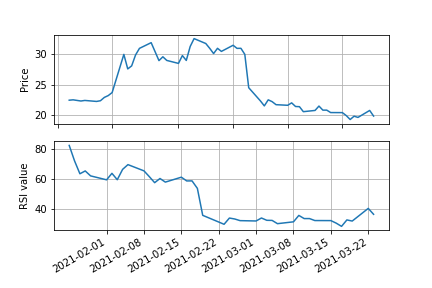
If the given equity passes the filter, we can compute the RSI for the whole period, which is useful for plotting.
rsi= df.ta.rsi(close=COL_CLOSE)
f, axs = plt.subplots(nrows=2, ncols=1)
# Plot the equity
axs[0].plot(df[COL_CLOSE])
# Plot the indicator
axs[1].plot(rsi)
# Align labels on the x-axis
f.autofmt_xdate()
axs[0].grid(True)
axs[0].set_ylabel('Price')
axs[1].grid(True)
axs[1].set_ylabel('RSI value')
It is also worth to save the plots for later investigation. We save the plots of the filtered equities as png files for later investigation.
fname, ext = os.path.splitext(name)
plt.savefig(fname)
plt.close()
Full source code
import os
import pandas as pd
import pandas_ta as ta
import matplotlib.pyplot as plt
from termcolor import colored


DB_PATH = r'./eqs/'
COL_DATE = ''
COL_CLOSE = ''
RSI_THRESHOLD = 50
RSI_WINDOW = 14


# Get all files in a given directory and its directories
for root, dirs, files in os.walk(DB_PATH, topdown=False):
    print("1st for {}".format(root))
    for name in files:
        fp = os.path.join(root, name)
        df = pd.read_csv(fp)
        # Convert data in string to date
        df[COL_DATE] = df[COL_DATE].apply(pd.to_datetime, format="%Y%m%d")
        # Restrict the data which is to be plotted to several months
        df = df[df[COL_DATE] >= '2021-01-01']
        # Make a date an index of the frame
        df.set_index(COL_DATE, inplace=True)
        # For faster computation take only the last RSI_WINDOW+1 data points
        df_test = df.iloc[-(RSI_WINDOW+1):].copy()
        rsi = df_test.ta.rsi(close=COL_CLOSE)
        if rsi[-1] > RSI_THRESHOLD:
            print(colored("{eq} RSI: {val}".
                  format(eq=fp, val=round(rsi[-1])), "red"))
            continue
        print(colored("{eq} RSI: {val}".
              format(eq=fp, val=round(rsi[-1])), "green"))
        # Compute again the indicator for a positively selected equity but this
        # time for all data points
        rsi = df.ta.rsi(close=COL_CLOSE)
        # Make plots for the filtered equities
        f, axs = plt.subplots(nrows=2, ncols=1)
        # Plot equity
        axs[0].plot(df[COL_CLOSE])
        # Plot indicator
        axs[1].plot(rsi)
        # Align labels on the x-axis
        f.autofmt_xdate()
        axs[0].grid(True)
        axs[0].set_ylabel('Price')
        axs[1].grid(True)
        axs[1].set_ylabel('RSI value')
        # Show plots
        # plt.show()
        # Save plots for later examination or show it
        fname, ext = os.path.splitext(name)
        plt.savefig(fname)
        plt.close()
