A portfolio is a collection of financial investments like stocks, bonds, commodities, closed-end funds and ETFs. Whether you manage your investment assets or choose to hire others to manage the assets on our behalf you want to know how well the portfolio of assets performs. Asset allocation, security analysis, portfolio construction and executing transaction executions are the investment decision process. The portfolio performance measurement is a part of the investment decision process, not external to it. Portfolio performance measurement answers the three basic questions:
- What is the return on assets?
- Why has the portfolio performed that way?
- How can we improve performance?
Transcalc allows you to find the answer to the first question. In the future the Transcalc will hopefully also answer the second and third questions.
Data import
Imported file format
TransCalc takes as an input a list of transactions stored in a CSV (comma separated value) file. The CSV file is usually exported from a broker service. An example file is included, which may look like
| Time | Equity | Buy/Sell | Amount | Price | Commission |
|---|---|---|---|---|---|
| 2018-05-31-13.14.06 | equity2 | B | 20 | 10 | 1 |
| 2018-06-04-09.32.09 | equity2 | S | 10 | 14 | 1 |
| 2018-06-30-13.14.01 | equity1 | B | 20 | 10 | 0,2 |
| 2018-07-01-09.32.05 | equity1 | S | 10 | 14 | 2 |
The columns are:
- Datetime – transaction date and time*
- Equity – name of an equity
- Buy_sell – the buy or sell indication. If omitted, the sign (+ or -) of the amount decides about the direction of a trade. Accepted are B or K for buy and S for sell transactions
- Amount – number of traded shares*
- Price – price for a single share*
- Commission – transaction commission or any additional cost
* – mandatory data
Date-time format
- Y
- year*
- m
- month*
- d
- day*
- H
- hour
- M
- minute
- S
- second
* – mandatory data
Examples
| Pattern | Date-time |
|---|---|
| Y-m-d-H.M.S | 2018-07-01-09.32.05 |
| Y-m-d | 2018-07-01 |
| Y/m/d-H:M:S | 2018/07/01-09:32:05 |
MS Excel and LibreOffice spreadsheets
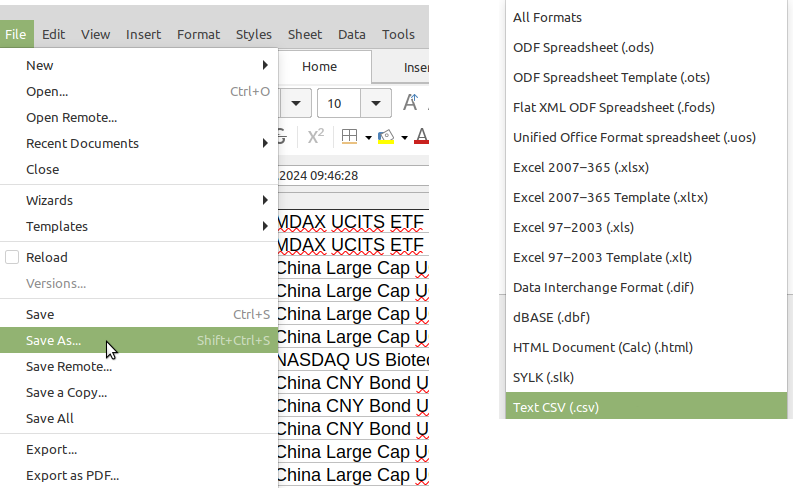
TransCalc currently does not support import from non-CSV files. However, if you stored your transaction data in MS Excel and LibreOffice spreadsheets, there is a simple way to convert it to a CSV file. When saving the data, from the list, select Text CSV, give a name to your file and save it as in the figure below.
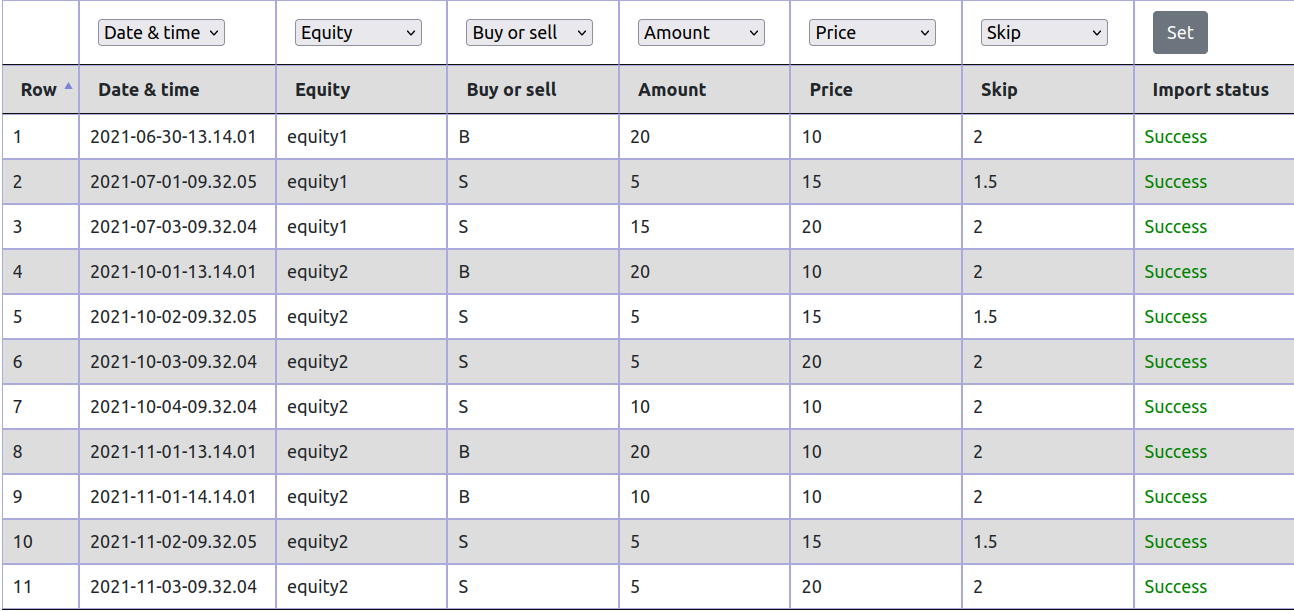
A successful import
When the parameters you specified match the imported data, the program successfully imports the data, and you can proceed to the Report generation step
When something goes wrong
When things go wrong, you get errors while attempting to import.
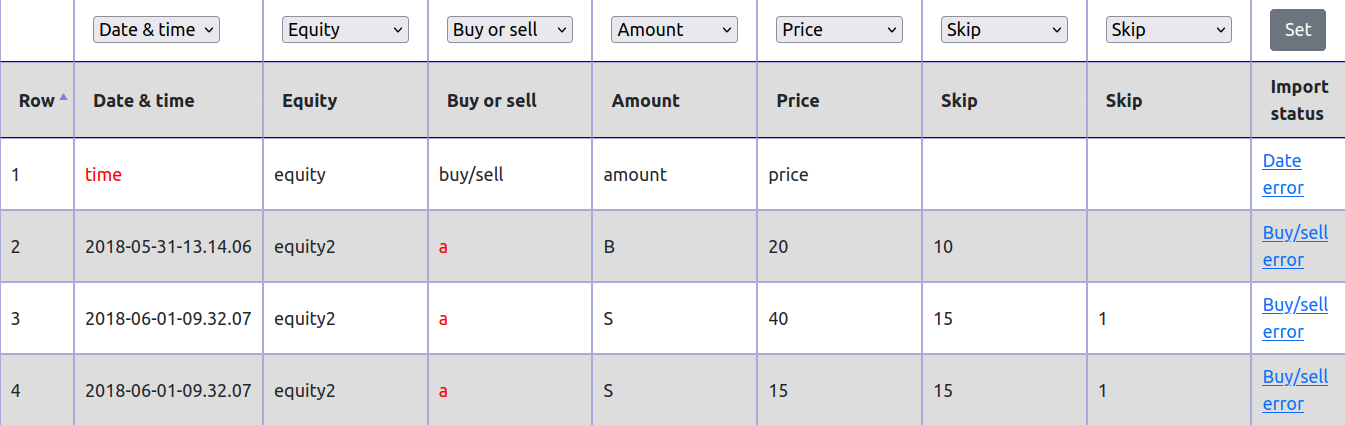
There can be:
- Date error:
the date or time format in the imported file doesn’t match the format given in the field Date-time format. - Buy/sell error:
you defined a column with trade direction, which requires B or K for buy and S for sell transactions. The data in the column doesn’t match this pattern. - Commission error:
the data in column Commission is not valid. - Price error: the data in column Price is not valid.
- Data incomplete: The data doesn’t have all mandatory fields – date-time, price and amount. If the data exists, check the columns separator.
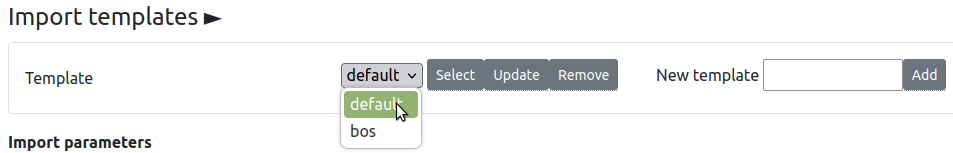
Import templates
You can define multiple templates, which allows you to import your data faster. You can add, update and delete your templates.
Reports
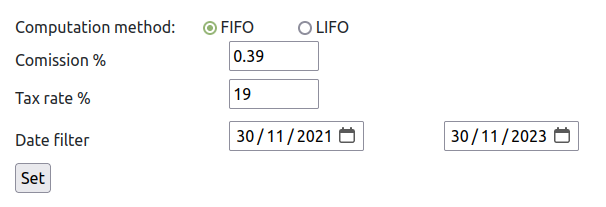
User-defined parameters
For the portfolio reports, you can specify the following parameters:
- Computation method: If your position is partial, i.e. you have an open position and closed its part, but not the whole, the selection of computation method has a significant impact on the tax you will pay. Select FIFO or LIFO. Depending on the tax law in your country, you may select or not the method for tax calculation.
- Commission: additional cost incurred by an investor during every transaction.
- Tax rate: tax in per cent to be paid of the capital gains. TransCalc assumes that the tax is a percentage from your gains.
- Dates: the period taken into account when generating the report.
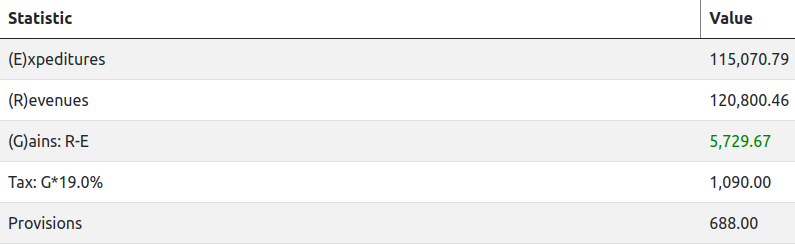
Portfolio summary
The report shows you the summary of the portfolio
- Expenditure: money invested
- Revenue: money returned
- Gain: money invested – money returned
- Tax: tax to be paid from the capital gains. This value can be approximate and depends on the tax law in your country. TransCalc assumes that the tax is a percentage of your gains. You specify the tax rate in the report parameters section.
- Commission: additional cost incurred by an investor during every transaction. Counted as a percentage of transactions.
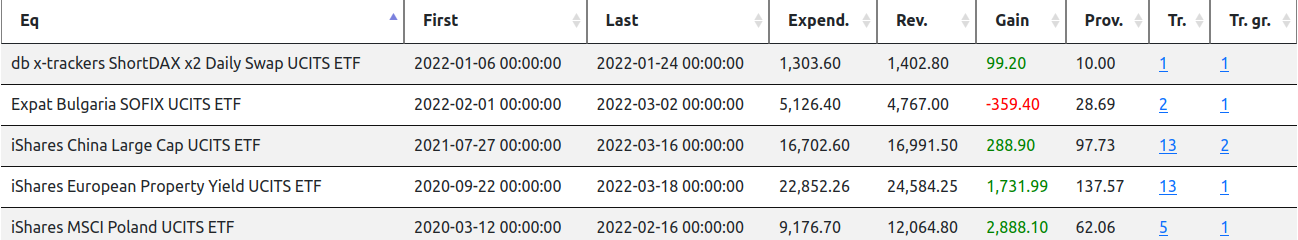
Equities performance
The report shows the performance of every equity. The following statistics are available:
- First transaction: the date of the earliest transaction taken into computation
- Last transaction: the date of the last transaction taken into computation
- Expenditure: money invested
- Revenue: money returned
- Gain: money invested – money returned
- Commission: additional cost incurred by an investor
- Transactions: list of transactions
- Transaction groups: list of transactions groups. Read more
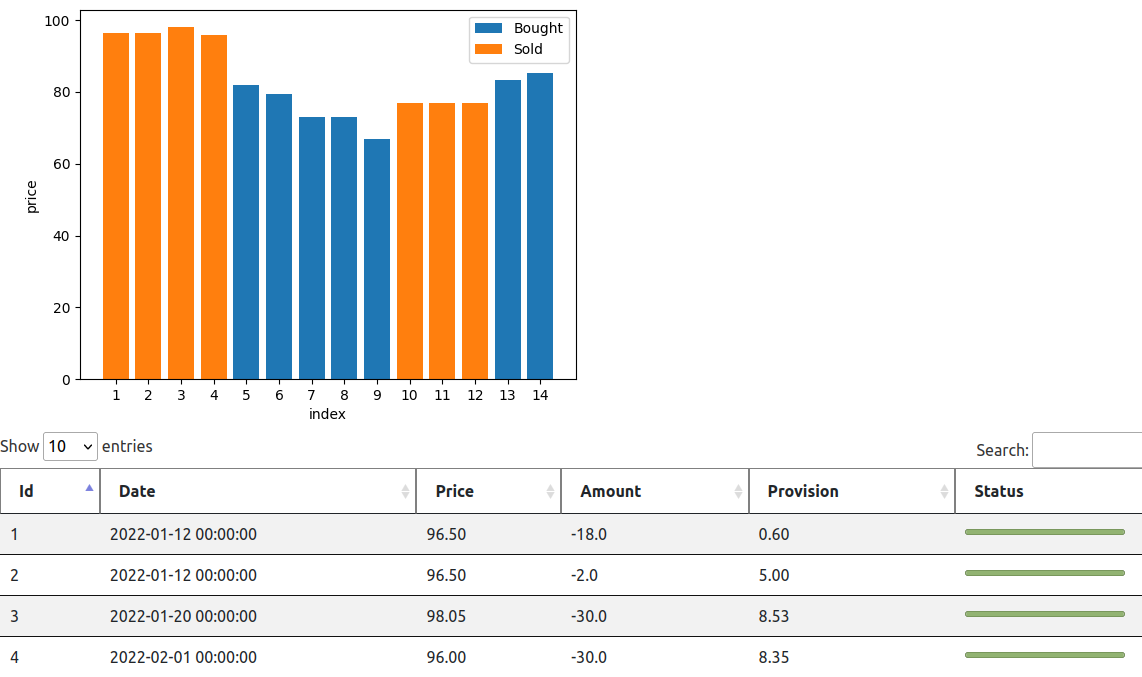
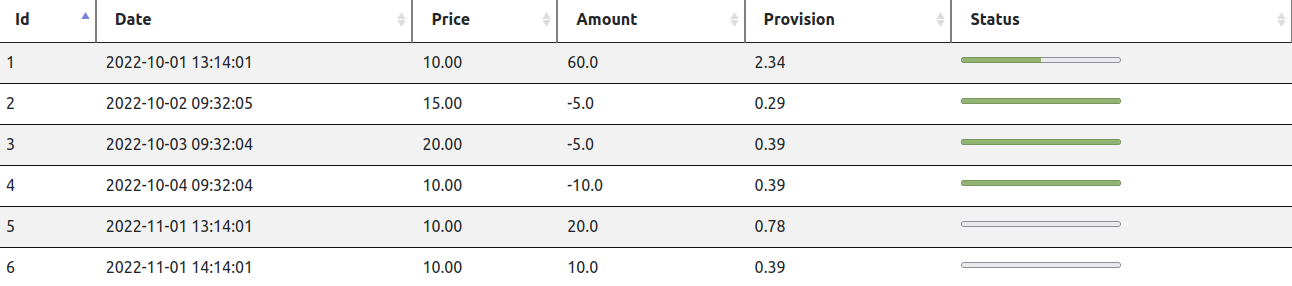
Equity transactions
The report shows a list of transactions for every equity in your portfolio. Additionally the report includes a simple chart, which visualises entry and exit prices for your equity.
The report shows the performance of every equity. The following statistics are available:
- Id: Transaction sequence number, the same is used in the chart
- Date: Transaction date
- Price: Transaction buy/sell price
- Amount: Amount of bought or sold shares
- Gain: money invested – money returned
- Commission: additional cost incurred in the transaction
- Status: Indicates if the position is open or closed. Read more
Transaction status
Taking and building a position
As an investor, you probably heard the term taking a position and a position building. You take a position when you buy (or sell shares to create a short position) in a particular equity. You take a position using a part of your funds, wait and at look how the market behaves, and then you decide what to do next. Your options are to take a larger position, withdraw from the position or keep the current position as it is. You repeat this process multiple times, which is position building. If you finish this process, i.e. you add no more funds to the particular investment, you have built your position, and you hope that it will be profitable.
Reducing and closing the position
After some time, the market circumstances change, and you start thinking about reducing your position or completely closing the position. If your market position is profitable, you will probably sell part of it to secure the gains. If the position is against you, you are likely to sell part of it to cut the losses. So, you are in the process of reducing your position. When you have pulled all your funds from the investment, you closed have the position.
Transaction status
When you build you position, you buy (or sell in the short-selling case) equities. Every transaction can have the following status:
- open, the invested money in this transaction is still in the market. Technically, there is no opposite transaction to balance it.
- partially closed. You pulled part of the money from this transaction. You have an open position and you sell part of it (but not the whole). Technically, this transaction is not fully balanced by an opposite transaction.
- closed, you pulled the money from the market. Technically, the closed transaction was balanced by an opposite transaction.
To understand the concept of open, partially closed and closed transactions better, look at the example below. We have here 4 transactions:
| Trans_id | Buy/Sell | Amount | Price |
|---|---|---|---|
| 1 | B | 10 | 10 |
| 2 | B | 20 | 15 |
| 3 | B | 10 | 15 |
| 4 | S | 15 | 20 |
After applying FIFO, we have
| Trans_id_1 | Trans_id_2 | Amount | Sell price | Gain |
|---|---|---|---|---|
| 1 | 4 | 10 | 20 | 100 |
| 2 | 4 | 5 | 20 | 25 |
| 3 | – | – | – | – |
Note, that the equity bought in transaction 3 has not been sold yet, while from transaction 2, we sold only 5 shares from 20.
After FIFO computations, the transaction status is
| Trans_id | Amount sold | Amount left | Status | Comment |
|---|---|---|---|---|
| 1 | 10 | 0 | Closed | sold in the Trans_id 4 |
| 2 | 5 | 15 | Part. open | 5 shares sold in Trans_id 4 |
| 3 | 0 | 10 | Open | no sell transaction to match |
Transaction groups
Investing is a repetitive process of opening, building, reducing and closing your position. After you close the position on a given equity, in the future maybe you will open the position on this equity again, adding another lap to this process. The breaks, when you don’t have a single share of a given equity, divide your transaction history into groups. Each group start by taking a position, building it, reducing it and closing. Sometimes, the history is short – you take the position, and in the next step, you close it because the market was against you. Other times, the transaction history within a group spans many years. You have built a position which gradually has been increasing its value, so you keep it.
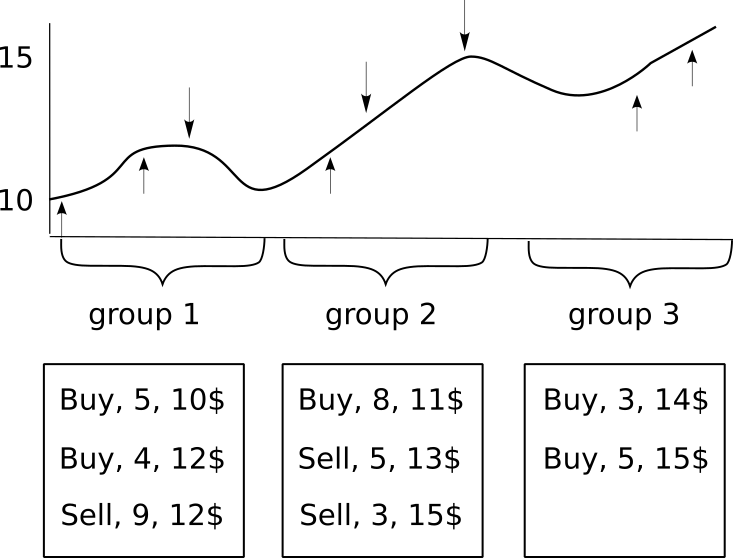
TransCals allows you to distinguish the transaction groups for each equity and display the performance for each group separately. The statistics of every group are the same as for the equity. TransCalc shows you the transaction dates, prices, amount, gain and commissions.

Further readings
Read more about how FIFO and LIFO affect capital gain tax.
- FIFO with Python code
- LIFO with Python code
- Differences between FIFO and LIFO